

7 Tips for Choosing the Right Turbidity Sensor
A clear-looking sample can still challenge a treatment process. A Turbidity Sensor helps operators detect suspended particles, track filtration performance, and spot sudden changes before they become costly problems. But choosing one is not just a matter of comparing specifications. A sensor that performs well in a clean laboratory sample may struggle with bubbles, changing flow, or a coated optical window in the field.
The U.S. EPA’s Surface Water Treatment Rules set a demanding benchmark for conventional and direct filtration: combined filter effluent turbidity must be 0.3 NTU or less in at least 95% of monthly measurements, and must never exceed 1 NTU. The World Health Organization also cautions that “turbidity can protect microorganisms from the effects of disinfection.” Its guidance makes clear why reliable measurement matters. Small differences matter. Water-quality researcher Dr. Jamie Bartram has contributed to international drinking-water guidance; for precise recommendations, consult the source document rather than relying on a paraphrase presented as his personal quotation.
This guide presents seven practical tips for selecting a sensor that suits your process. It covers measurement range, optical method, installation conditions, calibration, maintenance, data output, and total operating cost. Consider the realities of your site: a sensor mounted beside a turbulent pipe may need different installation planning than one monitoring a stable tank. Not all sensors agree. And no specification sheet can fully predict fouling or upkeep at your facility. Use these tips to compare options carefully, verify claims against manufacturer documentation, and choose a system your team can maintain consistently.
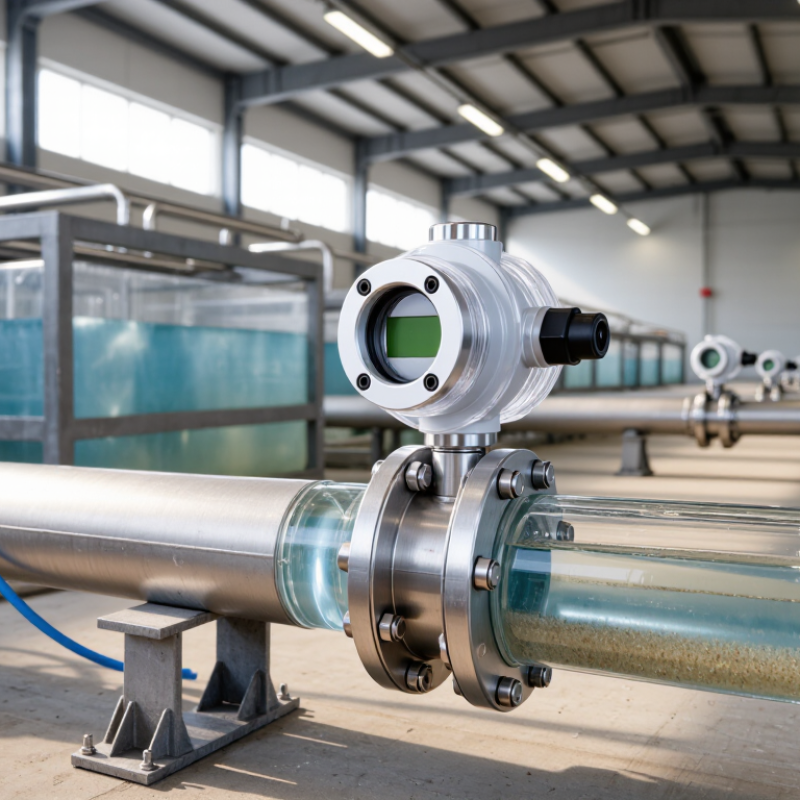
Define the Water-Quality Target: Drinking-Water Turbidity Is Preferably Below 1 NTU
For drinking-water monitoring, define the target before comparing turbidity sensors. The World Health Organization’s Guidelines for Drinking-water Quality (2017) recommend keeping turbidity below 1 NTU to support effective disinfection. The number is small, but consequential: particles can shield microorganisms from disinfectants, while rising readings may signal filtration problems. The U.S. EPA’s Surface Water Treatment Rule sets a tighter filtration benchmark: combined filter effluent should be at or below 0.3 NTU for at least 95% of monthly measurements, with no reading above 1 NTU. These figures serve different purposes: one supports disinfection, the other evaluates treatment performance.
Choose a sensor that reliably measures the range you need, not just one with a broad upper limit. Check low-range accuracy, resolution, repeatability, and calibration guidance. A display that changes by 0.1 NTU may still be inaccurate near the target. Small shifts matter. Bubbles, fingerprints on a sample vial, and settled particles can skew readings, so keep sampling and handling consistent. Compare field readings with a verified reference method. Also check response time and cleaning needs; a sensor may drift in warm, algae-rich water despite reassuring specifications. That deserves attention. Log results alongside filter changes and disinfection checks, since turbidity alone cannot confirm water safety.
Match the Optical Method: ISO 7027 Uses 860 nm, While EPA 180.1 Uses Visible Light
Turbidity sensors do not all “see” particles the same way. ISO 7027-1:2016 specifies infrared light at 860 nm, while U.S. EPA Method 180.1 uses a tungsten source with a spectral peak between 400 and 600 nm. Both methods measure scattered light, typically at 90 degrees, but their readings can differ in colored samples. That sounds simple. It isn’t. A sensor’s method, calibration, and sample conditions all matter.
Tip 1: Match the method to your reporting requirement. If results must follow EPA Method 180.1, choose a visible-light instrument; for ISO 7027, check that the sensor uses 860 nm. Do not assume readings are interchangeable, even when both display NTU. EPA Method 180.1 specifies a 400–600 nm peak, a useful detail to verify in the instrument documentation.
Tip 2: Consider sample color and test it. Visible light can be absorbed by colored water, affecting the signal; infrared can reduce that interference, but it cannot remove every matrix effect. Compare both methods on the same samples if color varies seasonally. Tip 3: Check the calibration range and standards against your expected readings. WHO’s Guidelines for Drinking-water Quality note that turbidity below 1 NTU supports effective disinfection. Near that level, small measurement differences matter. And field conditions can be messy. Record them.
| Tip | What to Check | Relevant Method Detail | Practical Selection Guidance |
|---|---|---|---|
| 1. Match the optical method | Confirm the sensor’s light source and the method required by your monitoring program. | ISO 7027-1 nephelometric measurement uses near-infrared light at 860 nm. U.S. EPA Method 180.1 uses a tungsten lamp with a specified color temperature of 2,200–3,000 K and a detector response in the visible-light region. | Choose a sensor designed for the applicable method. Readings from different optical methods may not agree for every sample, especially when particle size or color varies. |
| 2. Check the measurement geometry | Compare the detector angle and measurement configuration with the method and application. | Both methods use nephelometric detection at approximately 90° to the incident light beam. ISO 7027-1 specifies a detector angle of 90° ± 2.5° for its nephelometric method. | For method-based reporting, verify the instrument documentation rather than assuming all sensors with a 90° detector are method-equivalent. |
| 3. Select an appropriate measuring range | Consider expected minimum, normal, and peak turbidity, as well as the required resolution. | Usable range and resolution depend on the instrument design, optical path, sample, and measurement method; they are not determined by wavelength alone. | Choose a range that covers expected peaks without sacrificing useful resolution at routine levels. Check the specified range and performance under the conditions in which the sensor will operate. |
| 4. Confirm the reporting units | Check whether the application requires NTU, FNU, or another method-defined reporting convention. | NTU is commonly associated with EPA Method 180.1, while FNU is commonly used for ISO 7027 infrared nephelometric measurements. | Do not treat NTU and FNU as automatically interchangeable. Record the method and units, and establish any comparison using the actual water matrix and instruments involved. |
| 5. Evaluate sample color and particle characteristics | Consider dissolved color, suspended-particle size, shape, and composition. | Optical response can vary with the sample. Visible-light and 860 nm systems may respond differently to colored water and to particles with different scattering properties. | If samples are colored or vary substantially in particle composition, test candidate sensors on representative samples and compare results with the required reference method. |
| 6. Review calibration and verification needs | Check the calibration procedure, standards, frequency, and records required for the application. | Formazin-based standards are used in established turbidity measurement procedures, including EPA Method 180.1. Follow the applicable method and the sensor’s instructions for calibration and verification. | Use suitable, traceable standards and document calibration, checks, cleaning, and any corrective actions. Do not assume that a calibration for one optical method validates another. |
| 7. Match the sensor to the installation | Assess mounting, sample flow, bubbles, fouling, cleaning access, and maintenance requirements. | Bubbles, deposits on optical surfaces, and changing flow or sample conditions can affect optical measurements, regardless of the selected wavelength. | Choose a configuration that can be installed and maintained reliably at the measurement point. Plan routine inspection and cleaning, and verify performance in the installed setup. |
Choose a Measurement Range: EPA Method 180.1 Covers 0–40 NTU
EPA Method 180.1 covers turbidity measurements from 0 to 40 NTU using nephelometry. Treat that range as a useful reference, not a guarantee that every sensor performs equally well across it. A sensor intended for clear drinking water may need strong resolution near the low end. A process with cloudy water may require more headroom for occasional peaks.
Check your actual readings before choosing. Review routine results, then note the highest values seen during storms, filter changes, or cleaning cycles. If readings often approach 40 NTU, a wider-range instrument may prevent frequent over-range results. Samples above the method’s stated range may require suitable dilution and careful handling. Follow the method and the instrument’s instructions.
Small details count. Bubbles on the probe, settled particles, and changing sample flow can shift readings. I’ve seen a clean-looking sample produce unstable results after it sat in a bottle. That is a reminder, not a universal rule: sampling conditions matter. Compare the sensor’s range, resolution, and calibration needs with your own water and operating conditions. A range that looks perfect on paper can still be awkward in the field. Recheck your choice after collecting representative data.
Check Sensor Materials, Mounting, and Suitability for the Process
Tip: Match wetted materials to the liquid. Stainless steel may suit many clean-water lines, while corrosive or salty samples may require compatible plastics or specialty alloys. Check seals and optical windows too; a resistant body is not enough if an O-ring swells. Small details matter. Confirm temperature and cleaning-agent limits in the sensor documentation.
Tip: Choose mounting for the actual pipe or tank. In a full pipe, place the sensor where bubbles do not collect and solids remain representative. A short insertion probe may be easier to service, but it can read poorly near a wall or stagnant pocket. Keep access clear for wiping and calibration. I would still verify flow conditions on site; drawings can miss awkward clearances.
Tip: Fit the measurement method to the process. Suspended solids, color, particle size, and changing flow can affect readings. A sensor that performs well in clear water may drift in a dense slurry. Check its stated range, accuracy, and response time under conditions similar to your process. Test a sample if process behavior is uncertain.
7 Tips for Choosing the Right Turbidity Sensor
Check Sensor Materials, Mounting, and Suitability for the Process
The chart shows example nominal Formazin calibration levels in NTU; the appropriate calibration points depend on the measurement method and working range.
- Match the sensor’s measurement range to expected process turbidity.
- Check wetted materials against process chemicals, temperature, and cleaning agents.
- Choose an optical path and mounting position that reduce bubbles, sediment buildup, and stray light.
- Confirm the sensor suits the process flow, pressure, and installation space.
- Consider window fouling and whether automatic cleaning is needed.
- Verify calibration options, maintenance requirements, and access for servicing.
- Check that the output and communications work with the control system.
Plan Calibration, Cleaning, and Verification with Traceable Turbidity Standards
A turbidity sensor is only as dependable as its calibration history and the standards used to check it. Before choosing a model, confirm that its measurement range suits your water and that calibration records link to recognized reference materials. Select standards that bracket routine readings, not merely the sensor’s maximum range. For a process near 5 NTU, include a check close to that level and, where appropriate, a clean-water baseline. Keep standards sealed, mix them gently, and record their lot numbers, expiry dates, temperature, and use date. Small details matter.
Cleaning affects readings, too. Residue, fingerprints, or a scratched vial can scatter light and create misleading results. Follow the sensor’s cleaning instructions, use a lint-free cloth, and avoid abrasive tools on optical surfaces. Rinse away cleaning solution before verification. Then measure a traceable standard and compare the result with the instrument’s stated tolerance; repeat the check if readings vary. Record the value, cleaning performed, and any adjustment. Don’t recalibrate simply to make an unexpected reading disappear. That may conceal drift. A schedule that looks sensible on paper can still miss buildup in a real process, so review verification records and adjust intervals when trends justify it.

